In this article
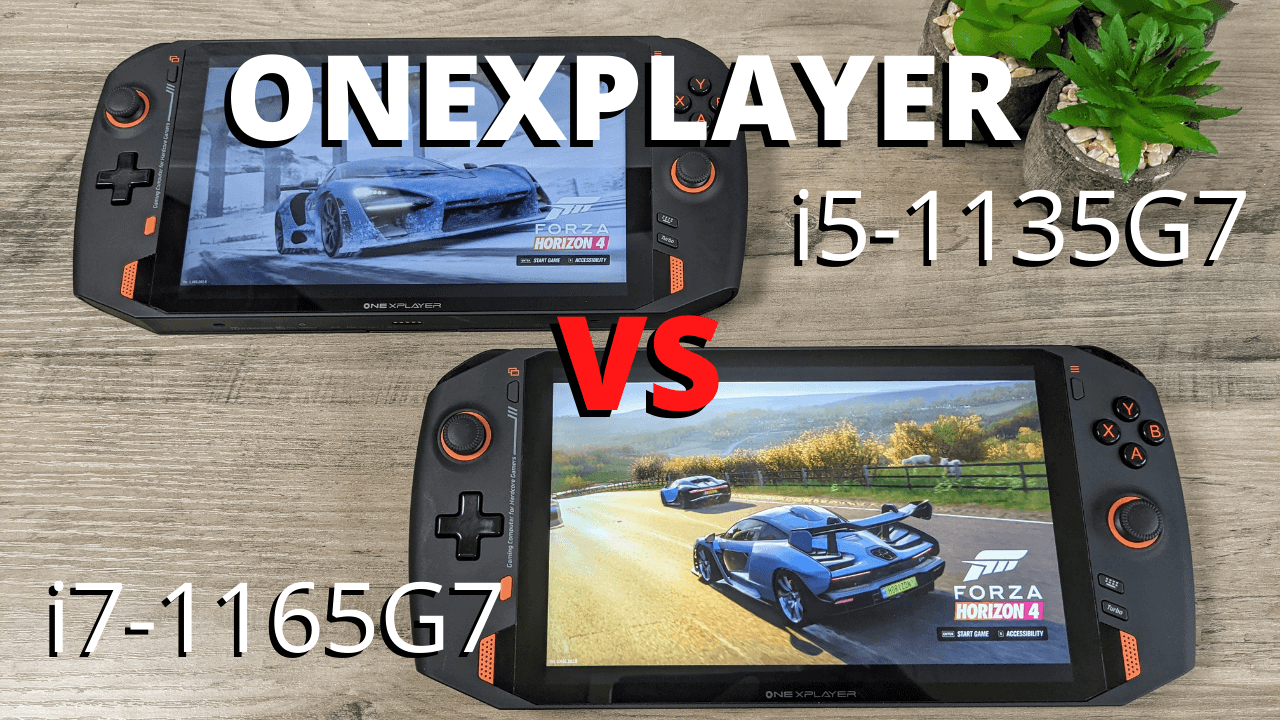
In the third part of our ONEXPLAYER series of articles we compare the i5 vs i7 in a series of system and gaming benchmarks.
If you missed our first part covering the unboxing and ONEXPLAYER overview you can find the article here which includes a video. The second part shows around a minute or so of gameplay covering nine AAA Windows games, you can find it here which also includes a video.
In this blog post we are running a series of benchmarks, first for system performance in artificial and real work scenarios, then afterwards a series of gaming benchmarks. We compare the ONEXPLAYER i5 vs i7 models to see the difference in performance between the two models.
You can find out more about and buy the ONEXPLAYER here. And browse our entire range of handheld game consoles here.
ONEXPLAYER BENCHMARK VIDEO
Watch our video showing the handheld gaming PC benchmark tests and results below. Or if you prefer, scroll down a little further for a text and images based version of the tests and results.
ONEXPLAYER i5 and i7 Technical Specifications
First, let’s take a look at the differences in technical specifications for both devices.
| MODEL: | ONEXPLAYER i5 | ONEXPLAYER i7 |
| CPU: | 1135G7 | 1165G7 |
| CORES: | 4 | 4 |
| THREADS: | 8 | 8 |
| SPEED: | 4.2 GHz | 4.7 GHz |
| GPU: | Intel Iris Xe | Intel Iris Xe |
| SPEED: | 1.3 GHz | 1.3GHz |
| EXECUTION UNITS: | 80 | 96 |
The i5-1135G7 and i7-1165G7 both have four cores and eight threads, but there is a difference in the maximum clock speed with 4.2 and 4.7 GHz respectively.
Both the ONEXPLAYER i5 and i7 have the same Iris Xe graphics running at 1.3 GHz. The i7 has 96 execution units, versus 80 on the i5. Execution Units are compute processors optimized for simultaneous Multi-Threading, so the more EU’s the higher the computing power.
Both models have the same 16GB Dual-Channel LPDDR4x RAM running at 4,266Mhz, as well as the 1TB High-Speed PCI-E NVMe SSD. We will be checking those for their performance as well.
ONEXPLAYER Benchmarks
To ensure fairness, the two models are set up identically. We are using the same screen resolution, graphics settings and Turbo mode disabled on both.
PassMark
We start the system benchmarks with PassMark, which gives us an overall indication of performance across the CPU, GPU, RAM and Storage. The i7 should naturally have a higher score, but by how much?

The i5 scores 3,032, with above average scores across the tests, and noticeably excelling on Disk speeds.
The ONEXPLAYER i7 scores 4,094 with excellent CPU, Memory and Disk Speed scores.
This gives us a 29.8 percent difference which is quite a gap. We double checked everything, re-run the tests and again got similar scores. Both models performed very well, but we can see a clear difference in the CPU, Graphics and Memory scores.
PCMark
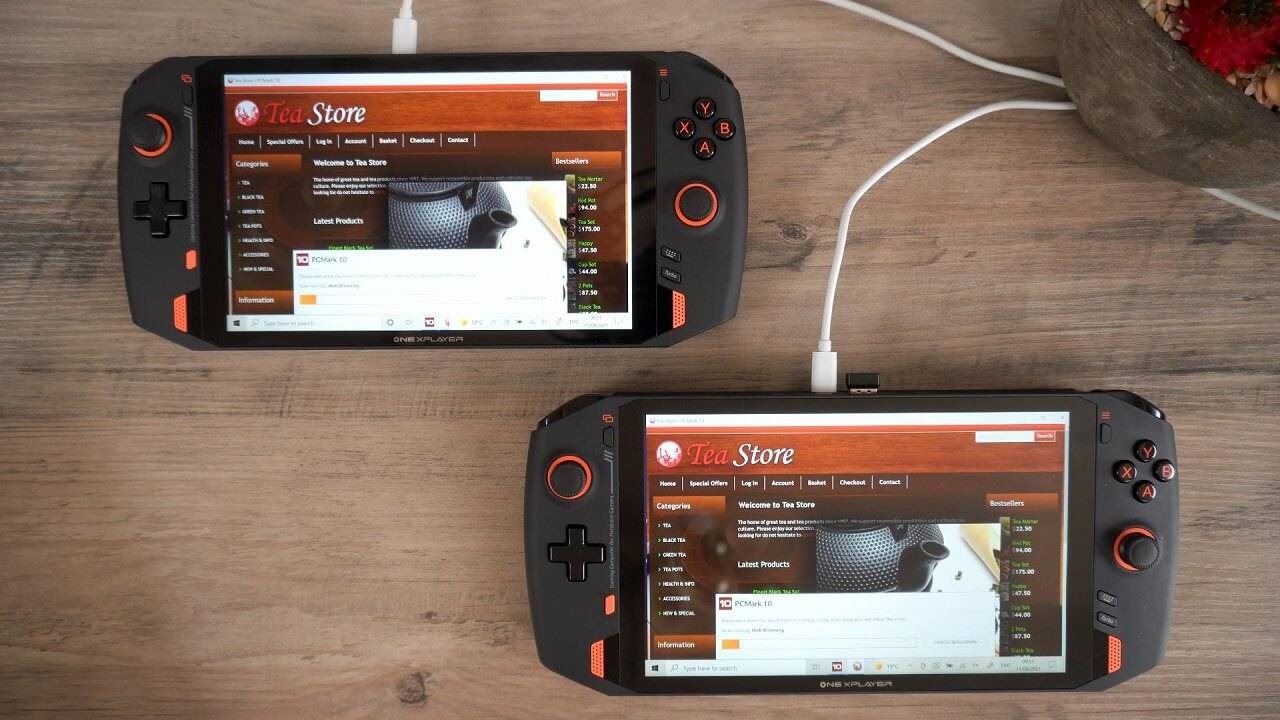
PCMark performs a more real world set of benchmark tests for a variety of day to day tasks including web browsing, media playing and image editing.
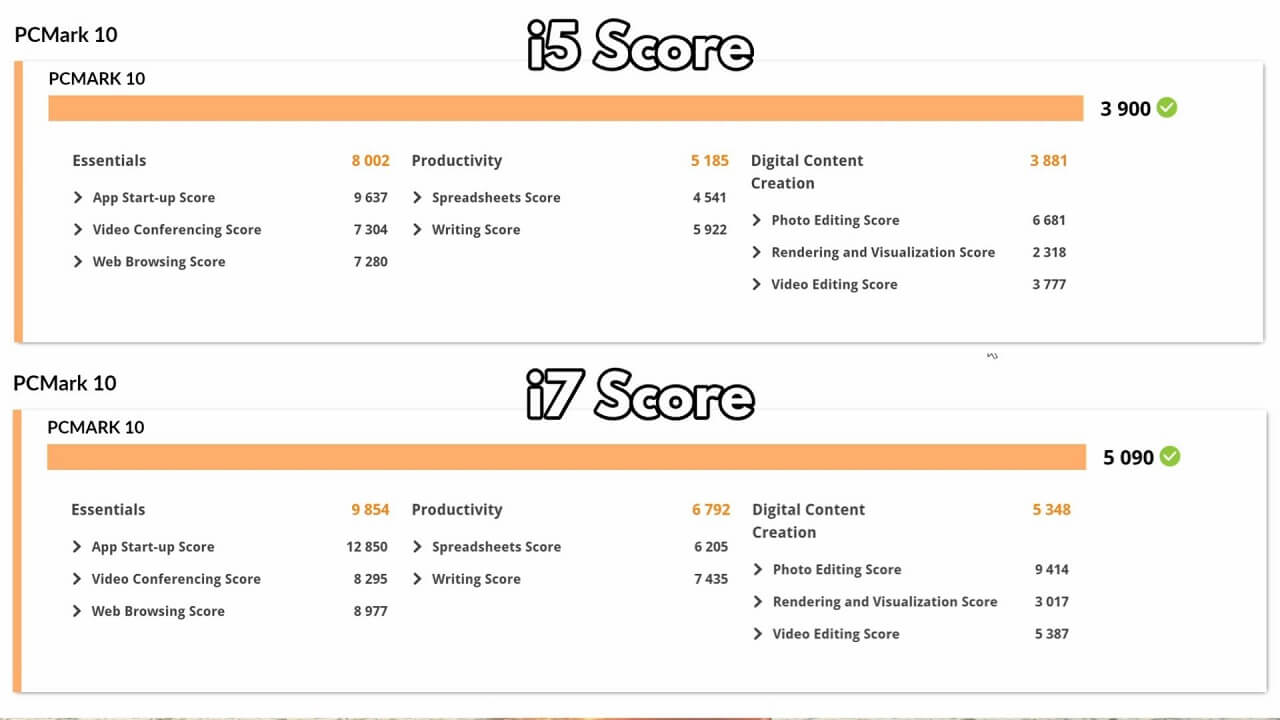
The ONEXPLAYER i5 scores a respectable 3,900 with good scores across all of the tests. The i7 scores a very impressive 5,090 with higher scores across all of the tests.
This gives us a 26% increase in performance on the i7 which is a similar difference in performance on PassMark.
In both the artificial and real world usage benchmarks there is a considerable increase in performance on the i7. This means that from booting into Windows, opening software and loading and saving large files, or example, will be noticeably faster on the i7.
3DMark
3DMark tests the CPU and Graphics for their performance. Not only is this a good test for gaming performance, but also for tasks such as media viewing, editing images and rendering video.
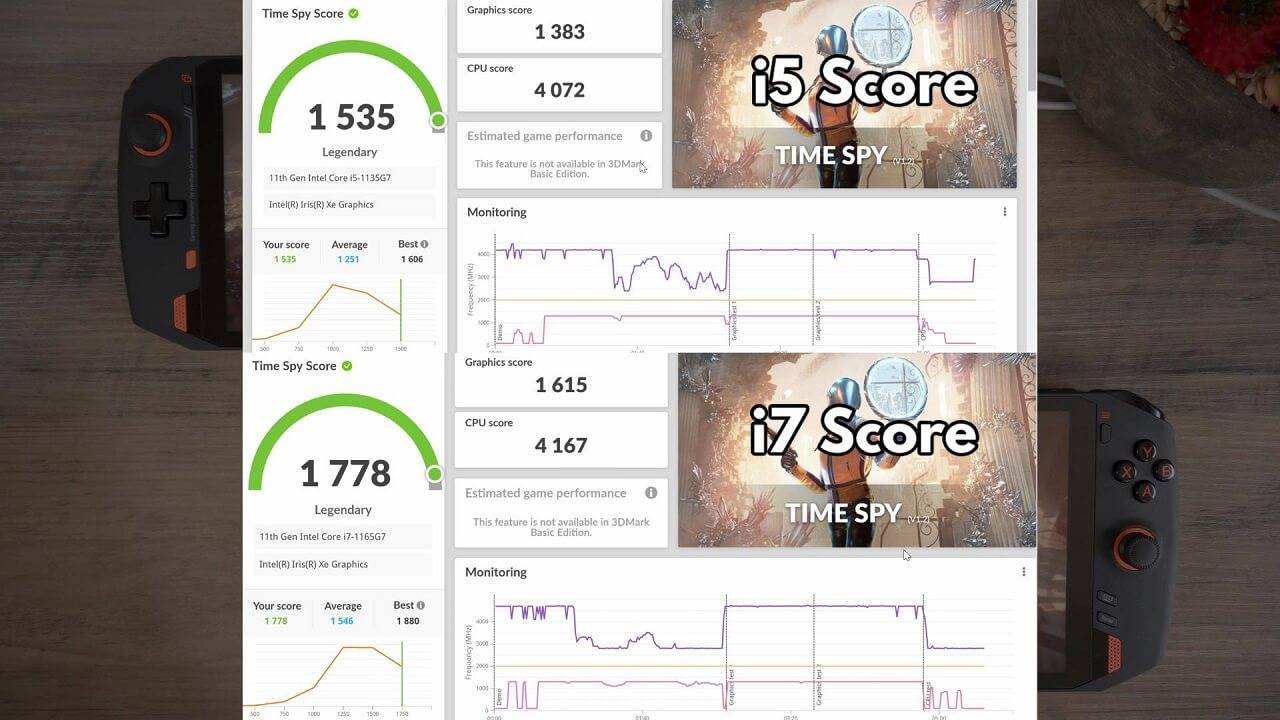
The i5 scores a very good 1,535, which is well close to the best scores recorded compared to other similar CPU configurations.
The ONEXPLAYER i7 scores 1,778, again close to the best scores on other similar CPU configurations.
The difference in performance between the i5 and i7 is a bit closer at 14%. Now that graphics rendering is tested fully, we can see that massive gap closing a little, but will it stay that way?
Disk Mark
Although we checked the SSD performance on PassMark, DiskMark gives us a closer look at the speeds of the internal storage over a series of tests.
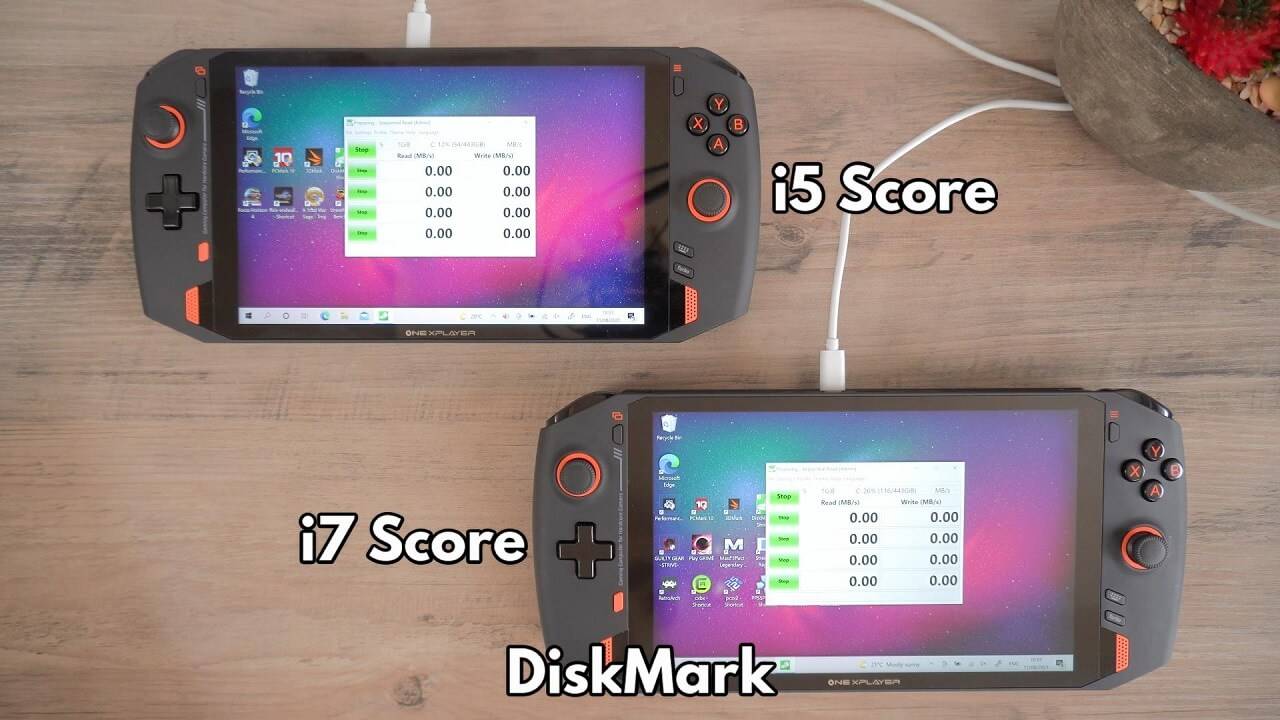
Both devices are getting read and write speeds of around the same amount as each other. There are slight differences but if we run the tests again we would again get differing scores.
And both are extremely impressive scores, that’s over 2.5 GB a second best reading and writing speeds!
ONEXPLAYER Gaming Performance
Now we move on to benchmarking the ONEXPLAYER i5 vs i7 for gaming which is what they are made for.

We are, in most cases, using the highest available graphics settings (i.e. Ultra) to really stress the CPU and GPU, so the games may not reach the full 60 FPS or above. Normally you may need to run at lower settings such as Medium and High, and/or have the Turbo mode enabled for optimum performance versus graphics quality.
A Total War Saga – Troy
We start first with Total War Sage Troy, which on Ultra settings is a very demanding game! We are running at 1920×1080 with the game’s default Ultra Settings.
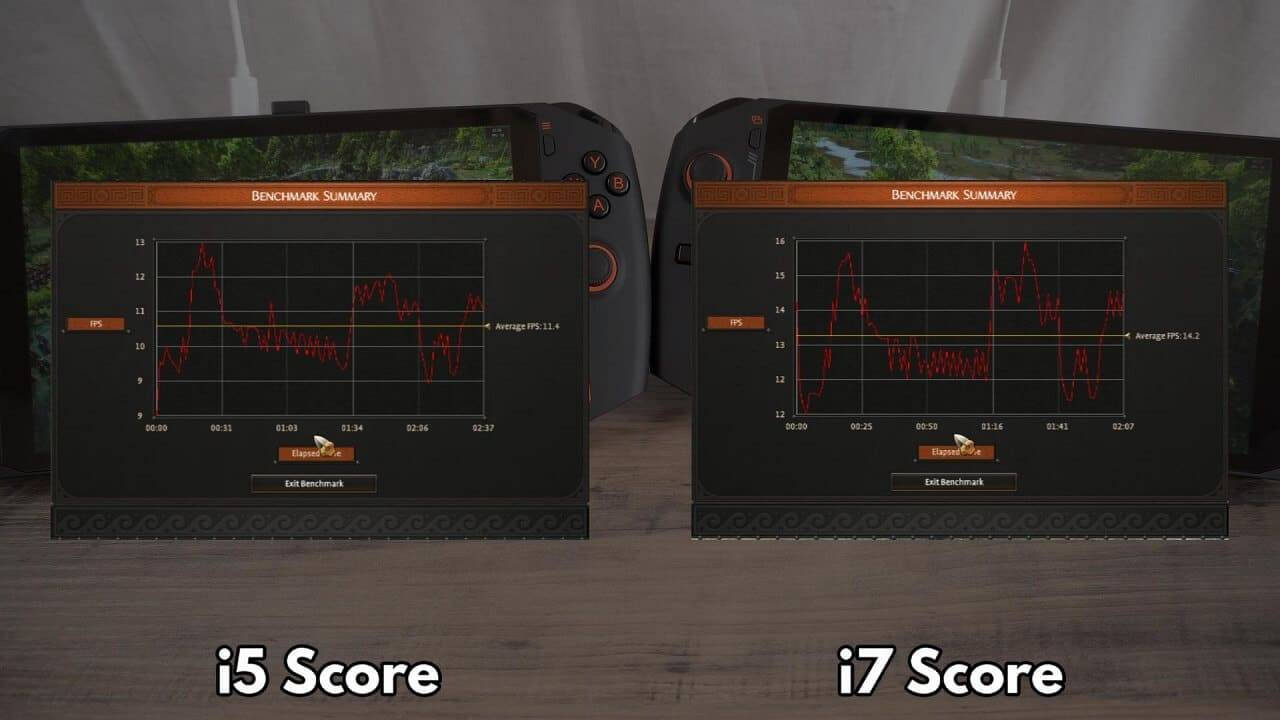
The ONEXPLAYER i5 has an average of 11.4 frames per second which is very reasonable at this resolution and graphics settings.
The i7 has an average of 14.2 frames per second. The difference is near 3 frames per second, which may not seem much, but that is a 21% difference.
Forza Horizon 4
While running the Forza Horizon 4 benchmarks, we had a few graphics glitches on both devices which leads us to think there may be a minor compatibility issue on the game or latest graphics drivers. I did play the game on the ONEXPLAYER in my other video previously with no issues. This did not seem to affect performance and it happened in the same places on both devices.
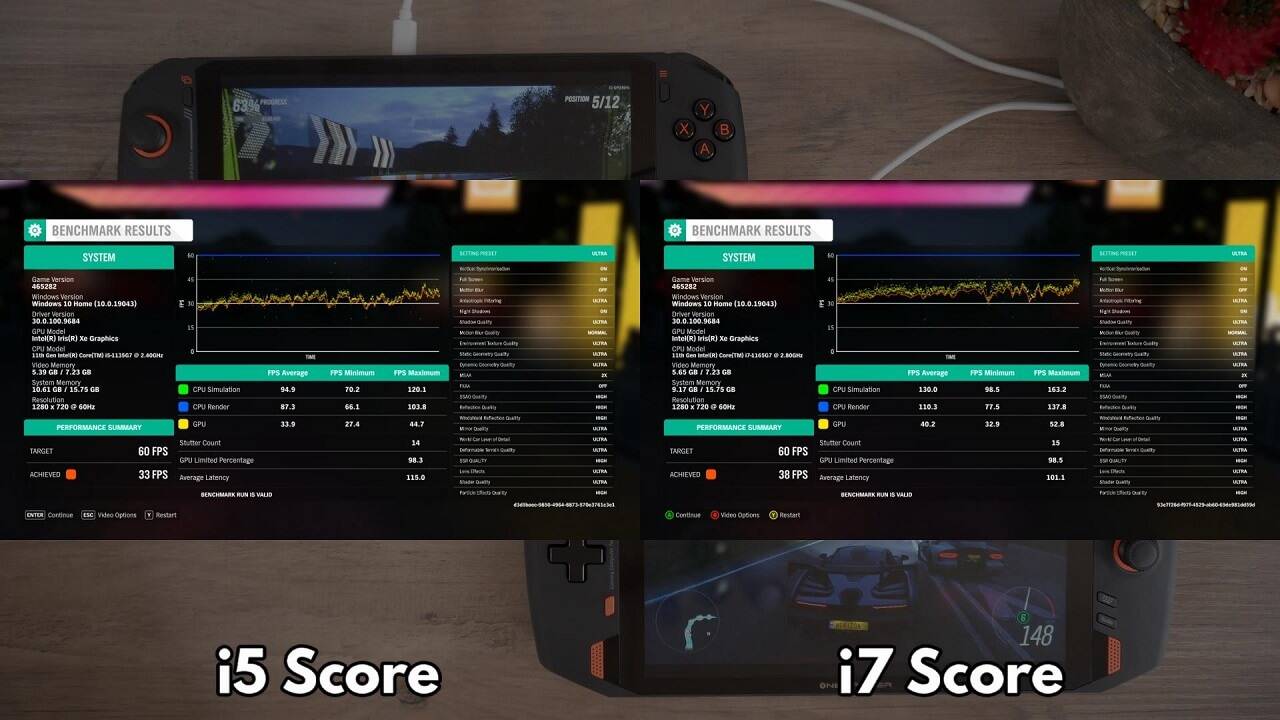
The i5 scores a very respectable 33 frames per second. With a low frame rate of 27 and high of 44.
The i7 scored a higher 38 frames per second. With a low of 32 and high of 52 frames per second.
The two average frame rates give us a performance difference of 14%. The percentage difference being lower may be due to the game being more optimised, as well as taking advantage of the multiple CPU cores and threads more efficiently on handheld game consoles. It is however, still a decent 14% difference.
Final Fantasy 14 Endwalker
We then benchmarked the forthcoming Final Fantasy 14 expansion called Endwalker. We are running this benchmark on the ONEXPLAYER at 1920×1080 on High settings, with the only setting changed being to make it run Full Screen instead of a Window.
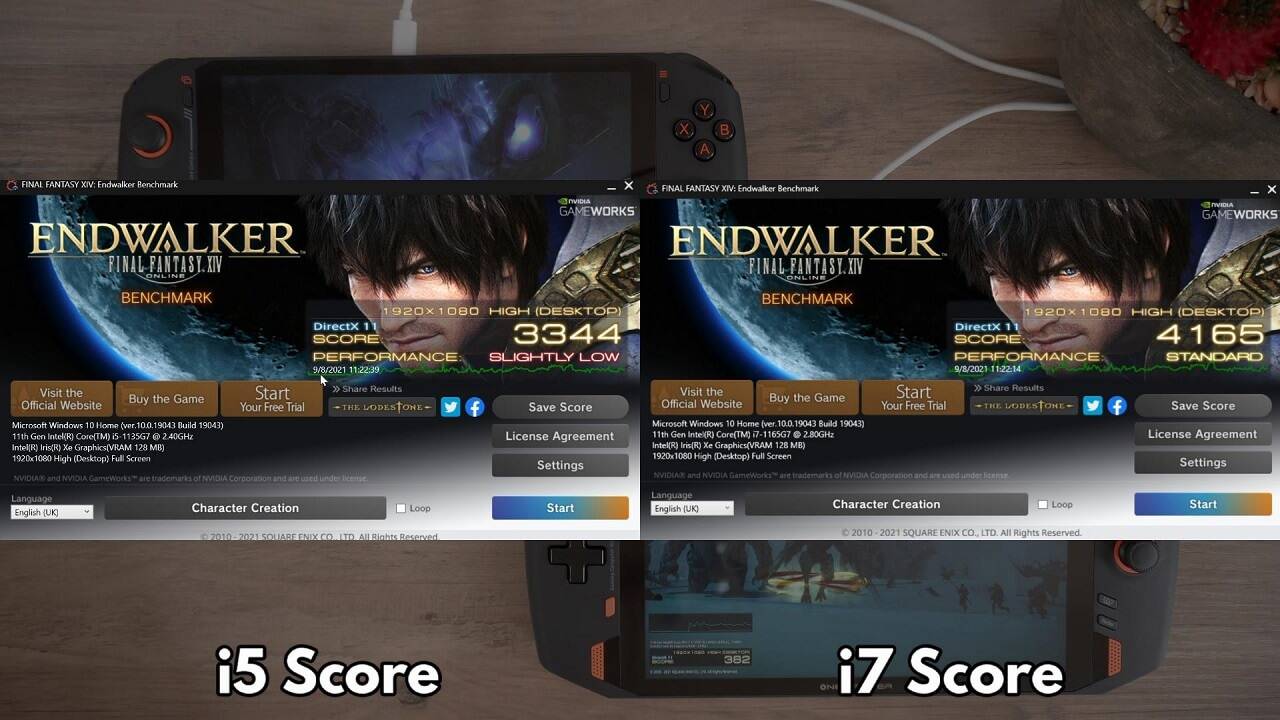
The i5 scores 3 thousand 3 hundred and 44, with a ‘slightly low’ performance rating.
The i7 scores a higher 4 thousand 1 hundred and 65, even running well enough to reach the ‘Standard’ rating to play the game which is impressive.
This gives us a score difference of 21%. With a few tweaks the ONEXPLAYER i5 would be able to play the game with no issues. The ONEXPLAYER i7 however should be fine to play straight away, maybe turning on Turbo for a performance boost and increasing a few settings.
Street Fighter V
For this test on Street Fighter V we are running the game at 1920×1080 with all graphics settings at maximum.

Despite the i5 at the top starting the benchmark first by around 2 or so seconds. You will see by the end of the round, that the i7 on the bottom actually catches up because of the increased frame rate and how the game works.
ONEXPLAYER Benchmark Summary
| ONEXPLAYER i5-1135G7 | ONEXPLAYER i7-1165G7 | % diff. | |
| PASSMARK | 3032 | 4094 | 29.8% |
| PCMARK | 3900 | 5090 | 26% |
| 3DMARK | 1535 | 1778 | 41% |
| A TOTAL WAR SAGA: TROY | 11.4 FPS | 14.2 FPS | 21% |
| FORZA HORIZON 4 | 33 FPS | 38 FPS | 14% |
| FINAL FANTASY XIV: ENDWALKER | 3344 | 4165 | 21% |
| AVERAGE % | 20.9% | ||
| PRICE | £1,049.00 | £1,149.00 | 9% |
This gives an average difference across the benchmarks of 20.9%, which is a fairly large gap, especially when there is only a 9% difference in price. The OneNetbook ONEXPLAYER i7 model is a clear winner in terms of performance versus price!
Considering what we saw with the GPD Win 3 i5 vs i7 benchmark tests, the performance differences were not as large. It made sense to consider both devices, mainly based on the price you wanted to pay. But with the ONEXPLAYER, it is a no-brainer to opt for the i7 model, the small extra cost is definitely worth the performance gain!
We hope this video and article has provided a good insight in how the ONEXPLAYER i7 vs i5 models compare to each other. You can learn more about and buy the ONEXPLAYER here. Also you can browse our range of handheld game consoles here.
Bringer of videos, text and images! AKA the social media guy at DROIX. Massive retro gaming fan and collector, with a far too large collection of consoles and computers from 1970's to modern. Contact me at [email protected]
Questions & comments
0Every question gets an answer. Ask before you buy — DaveC and the team reply within one working day, and answers stay public so they help the next reader too.